
ALTURAS BUSINESS FUND
ALTURAS BUSINESS FUND
ALTURAS BUSINESS FUND
Quarterly Report
Q2 2025
The second quarter of 2025 marked a significant phase of reinvestment in our portfolio companies, and we are continuing to see incremental returns as we work to create consistency within each company. Our average realized return was 7.82%, fueled by strong momentum at Idaho Fitness Factory (IFF) and steady progress at The Studio Academy of Beauty (TSAOB).
We completed two major initiatives at Idaho Fitness Factory: opening the new Eagle & Chinden club and upgrading all existing gyms to meet our standards. This included our final round of equipment swaps within the original eight clubs to elevate the member experience. As a result, we experienced accelerated member growth, and an increase in positive reviews across the Treasure Valley.
The Studio Academy of Beauty is experiencing incremental growth through strategic reinvestment in technology, staff development, and improved brand presentation. We have implemented additional tools to increase both the employee and student experience. The ongoing improvements are showing signs of stabilization. Our campus feels vibrant, our teams are empowered, and our students are engaged.
Looking ahead, we will continue on our strengthened foundations by applying the lessons learned from our expansion strategies to grow both within Idaho and into new states, while refining the TSAOB experience to drive enrollment and retention. With strategic capital deployment, consistent standards, and a people-first approach, we are confident in the path we have set for the remainder of 2025.

Lucas Henken
Alturas Ventures
Blake Hansen
Alturas Ventures
The second quarter of 2025 marked a significant phase of reinvestment in our portfolio companies, and we are continuing to see incremental returns as we work to create consistency within each company. Our average realized return was 7.82%, fueled by strong momentum at Idaho Fitness Factory (IFF) and steady progress at The Studio Academy of Beauty (TSAOB).
We completed two major initiatives at Idaho Fitness Factory: opening the new Eagle & Chinden club and upgrading all existing gyms to meet our standards. This included our final round of equipment swaps within the original eight clubs to elevate the member experience. As a result, we experienced accelerated member growth, and an increase in positive reviews across the Treasure Valley.
The Studio Academy of Beauty is experiencing incremental growth through strategic reinvestment in technology, staff development, and improved brand presentation. We have implemented additional tools to increase both the employee and student experience. The ongoing improvements are showing signs of stabilization. Our campus feels vibrant, our teams are empowered, and our students are engaged.
Looking ahead, we will continue on our strengthened foundations by applying the lessons learned from our expansion strategies to grow both within Idaho and into new states, while refining the TSAOB experience to drive enrollment and retention. With strategic capital deployment, consistent standards, and a people-first approach, we are confident in the path we have set for the remainder of 2025.
Alturas Ventures
Lucas Henken
Alturas Ventures
Blake Hansen

Big News for Q2
Big News for Q2
Big News for Q2

Idaho Fitness Factory
Completed final equipment swap across all locations.
11th location - On track to open in June with updates and improvements
12th location - On track to open January 2025
Idaho Fitness Factory
Completed final equipment swap across all locations.
11th location - On track to open in June with updates and improvements
12th location - On track to open January 2025
Idaho Fitness Factory
Completed final equipment swap across all locations.
11th location - On track to open in June with updates and improvements
12th location - On track to open January 2025

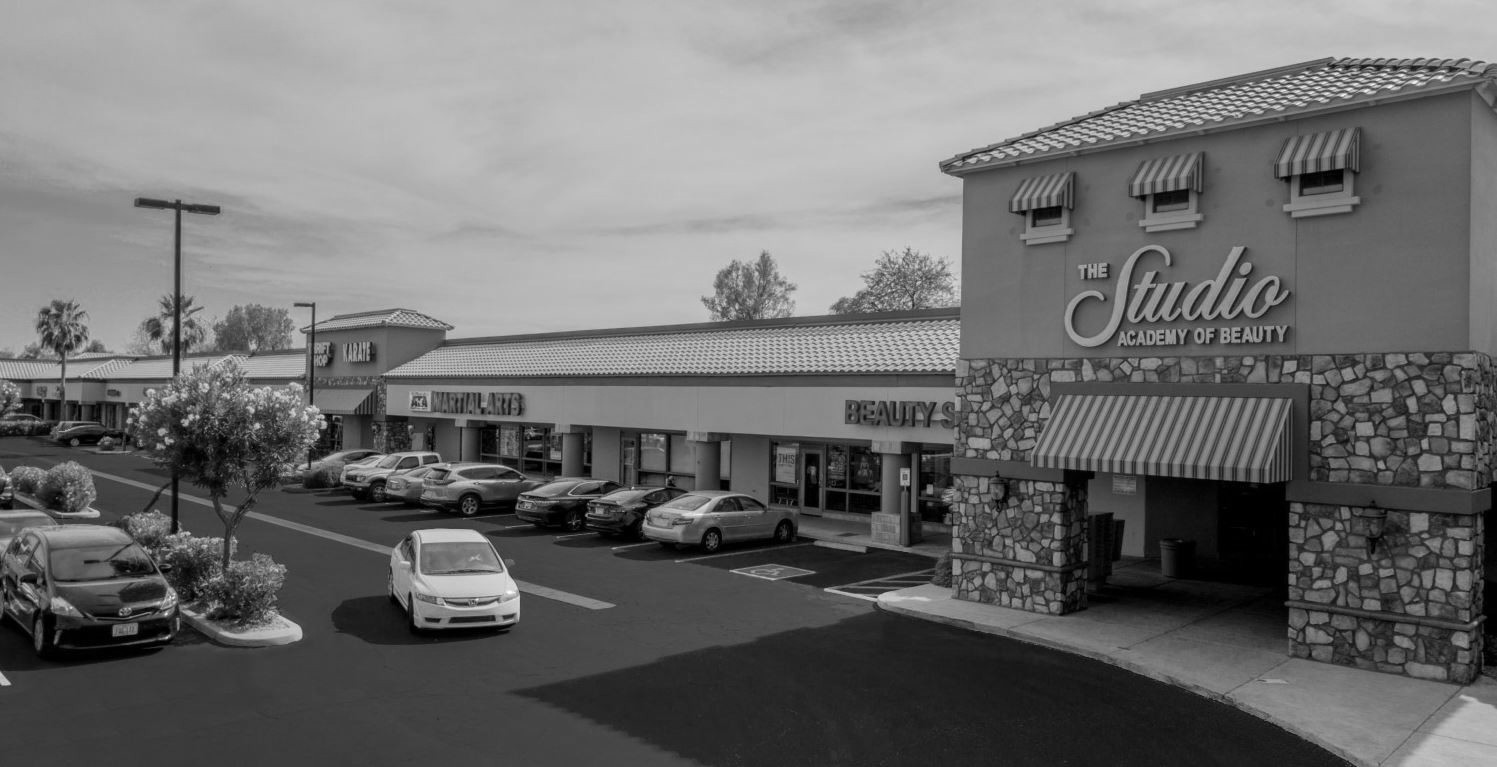
The Studio Academy of Beauty
Tenant Improvements to elevate campus aesthetics and student excitement
Improved leads and starts
Hired a new director of education
The Studio Academy of Beauty
Tenant Improvements to elevate campus aesthetics and student excitement
Began implementing new systems and processes for admissions
Hired a new director of education
The Studio Academy of Beauty
Tenant Improvements to elevate campus aesthetics and student excitement
Improved leads and starts
Hired a new director of education

Key Quarterly Numbers
Key Quarterly Numbers
Key Quarterly Numbers
7.82%
Average Realized Return Q2
7.82%
Average Realized Return Q2
7.82%
Average Realized Return Q2
7.82%
Average Total Return Q2
7.82%
Average Total Return Q2
7.82%
Average Total Return Q2
$1,328.30
Unit Price
$1,328.30
Unit Price
$1,327.31
Unit Price
$346,487
Realized Net Income Q1
$346,487
Realized Net Income Q1
$346,487
Realized Net Income Q1
$3,252,955
Realized Net Income Since Inception
$3,252,955
Realized Net Income Since Inception
$3,252,955
Realized Net Income Since Inception
Stated returns are average annualized investor returns. Individual investor returns may vary based on the unit pricing at the time of investment. Realized net income includes realized gains and losses and excludes unrealized gains and losses recorded during the period. Financial information herein related to the quarters ended in 2025 are unaudited as of the date of this report.
Unit Price
Realized Returns
Returns Since Inception

Additional Fund Metrics
Additional Fund Metrics
Additional Fund Metrics
Additional Fund Metrics
43
Number of Investors
43
Number of Investors
43
Number of Investors
78.19%
Reinvestment Rate
78.19%
Reinvestment Rate
78.19%
Average realized return
$12,671,707
Total Capital Raised
$12,671,707
Total Capital Raised
$12,671,707
Total Capital Raised
$2,364,910
Investor Distributions Since Inception
$2,364,910
Investor Distributions Since Inception
$2,364,910
Average realized return
Assets Under Management
Assets Under Management
Assets Under Management
*Distributions since inception includes Q2 2025 distributions paid on 06/31/2025.
Idaho Fitness Factory
The second quarter of 2025 built directly on the momentum we established in Q1, driving membership growth and the quality of the member experience across every club. We finalized our full equipment upgrade across all eight legacy locations, including final replacements at Franklin and Nampa, and a full-club refresh at Paramount. This milestone ensures that every Idaho Fitness Factory, whether legacy or newly built, now offers a consistent, high-quality equipment package, including new cardio suites, strength rigs, and functional-training zones. These enhancements contributed to measurable uplifts in both new joins and member satisfaction.
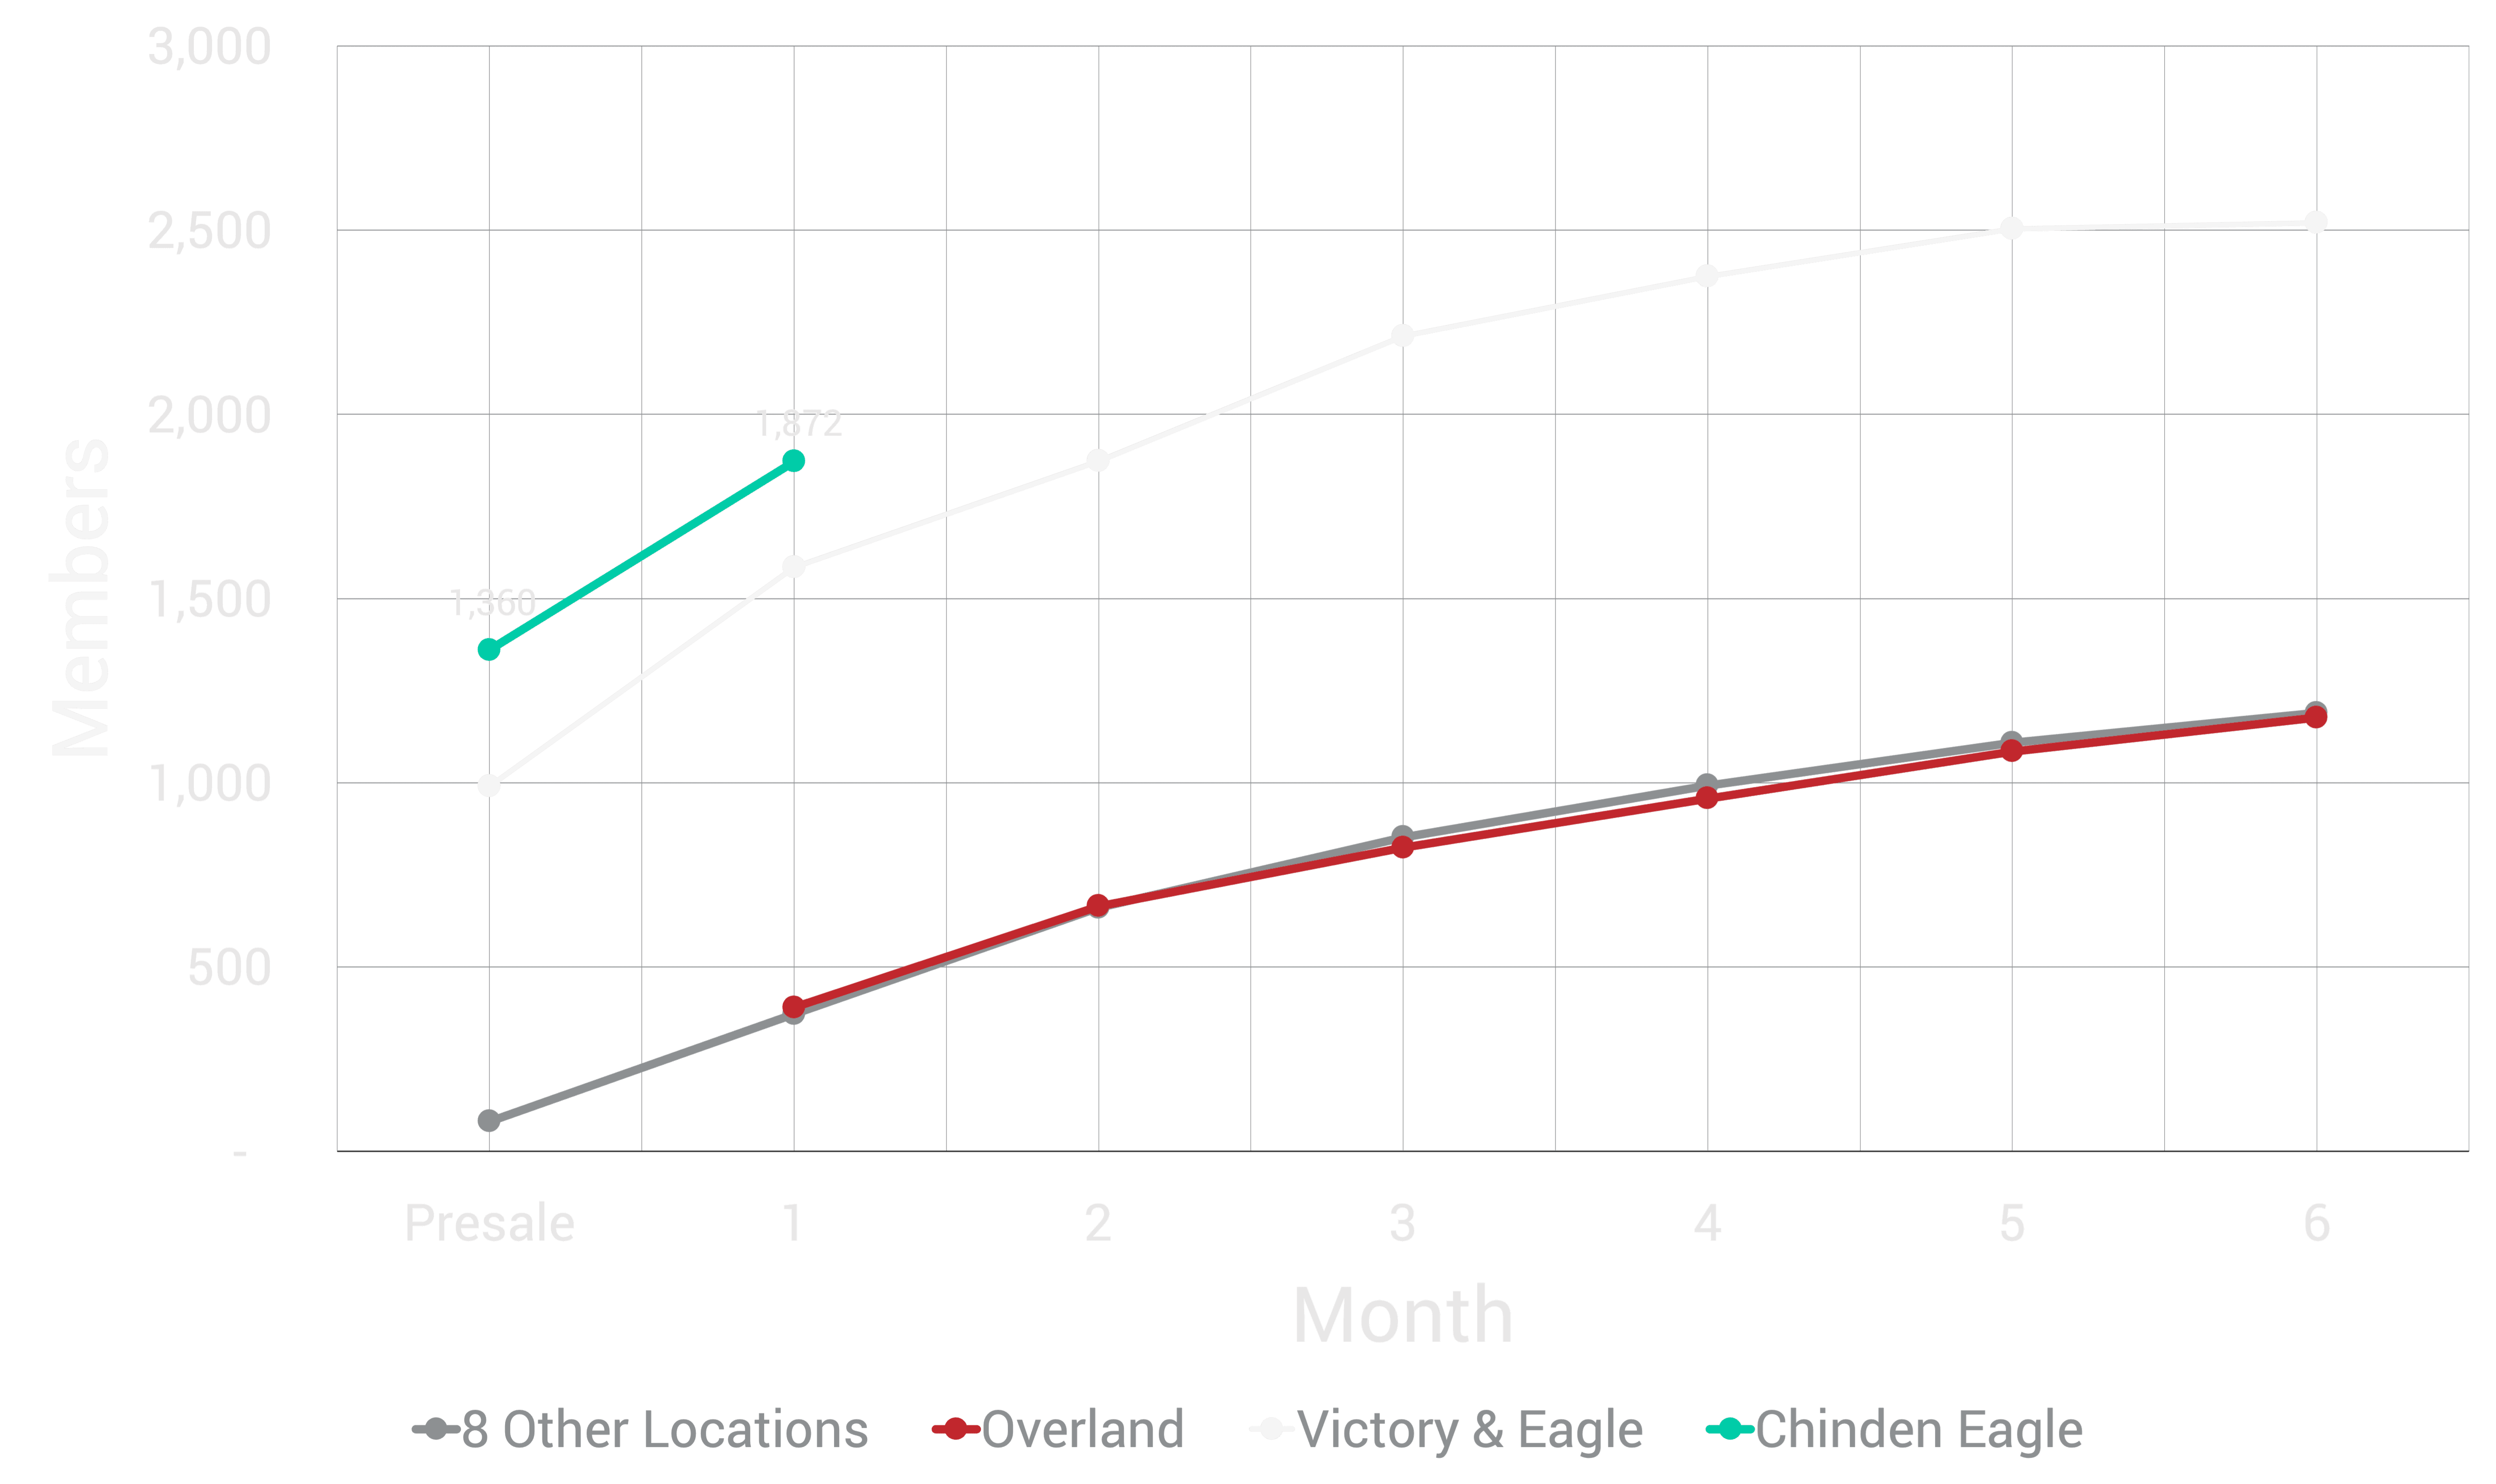
Eagle & Chinden
At Eagle & Chinden, we leveraged best practices from recent launches to secure 1,360 pre-opening members and deliver a seamless grand opening on June 17.
Victory & Eagle
Victory & Eagle, now in its third quarter of operation, continues to outperform projections, reaching 2,735 members as of June 30. Across the portfolio, total membership climbed to 24,830, representing a quarter-over-quarter increase of 2,298, and underscoring the strength of our value proposition and the operational leverage gained through the equipment rollout. Spanning 110,511 total square feet, our clubs now serve an average of 2,442 members each.
Financially, Q2 revenue reached $2,141,199, driven by continued membership growth and expanded service offerings. Construction is well underway on our twelfth location, which remains on track for a January 2026 opening. These initiatives reflect the disciplined playbook that continues to power Idaho Fitness Factory, investing in existing assets, replicating success in new markets, and continually improving the member journey through both physical and digital enhancements. As we enter the second half of 2025, we remain confident in our ability to sustain growth across both legacy markets and new frontiers.
Looking Ahead
Idaho Fitness Factory
The second quarter of 2025 built directly on the momentum we established in Q1, driving membership growth and the quality of the member experience across every club. We finalized our full equipment upgrade across all eight legacy locations, including final replacements at Franklin and Nampa, and a full-club refresh at Paramount. This milestone ensures that every Idaho Fitness Factory, whether legacy or newly built, now offers a consistent, high-quality equipment package, including new cardio suites, strength rigs, and functional-training zones. These enhancements contributed to measurable uplifts in both new joins and member satisfaction.
Financial Summary
Idaho Fitness Factory delivered a quarter of strategic reinvestment and strong execution, finalizing equipment upgrades across all eight legacy clubs and successfully launching our eleventh location at Eagle & Chinden. These efforts unified the member experience across the portfolio and drove continued membership and revenue growth, positioning us for sustained momentum in the second half of 2025.
Summary
Summary
(in thousands)
(in thousands)
Revenue
Revenue
Facilities Expense
Facilities Expense
Payroll Expense
Payroll Expense
Sales and Marketing Expense
Sales and Marketing Expense
G&A Expense
G&A Expense
Total Expenses
Total Expenses
Net Operating Income
Net Operating Income
Other Income
Other Income
Interest Expense
Interest Expense
Dep/Amort Expense
Dep/Amort Expense
ASC 842
ASC 842
Net Income
Net Income
Principal Paydown
Principal Paydown
Capex
Capex
Q3 2024
Q3 2024
$1,562
$1,562
493
493
353
353
100
100
174
174
1,121
1,121
420
420
(226)
(226)
58
58
98
98
20
20
39
39
188
188
$695
$695
Q4 2024
Q4 2024
$1,979
$1,979
504
504
390
390
112
112
221
221
1,226
1,226
753
753
(38)
(38)
72
72
133
133
63
63
447
447
190
190
$337
$337
Q1 2025
Q1 2025
$2,158
$2,158
597
597
428
428
142
142
443
443
1,610
1,610
548
548
12
12
65
65
0
0
0
0
495
495
213
213
$18
$18
Q2 2025
Q2 2025
$2,141
$2,141
597
597
478
478
134
134
447
447
1,656
1,656
485
485
(190)
(190)
72
72
0
0
0
0
206
206
367
367
$793
$793
Total
Total
$7,840
$7,840
2,192
2,192
1,649
1,649
488
488
1,285
1,285
5,614
5,614
2,206
2,206
(442)
(442)
267
267
231
231
83
83
1,187
1,187
958
958
$1,843
$1,843
Idaho Fitness Factory Metrics and Key Performance Indicators
Idaho Fitness Factory Metrics and Key Performance Indicators
Idaho Fitness Factory Metrics and Key Performance Indicators
$2,141,199
Quarterly Revenue Q2
$2,141,199
Quarterly Revenue Q2
37.7%
YoY Change
37.7%
YoY Change
24,422
Total Members
24,422
Total Members
-
YoY Change
-
YoY Change
$798,000
Quarterly Profit Q2
$798,000
Quarterly Profit Q2
205%
YoY Change
205%
YoY Change
$2,141,199
Quarterly Revenue Q2
37.7%
YoY Change
24,422
Total Members
-
YoY Change
$798,000
Quarterly Profit Q2
205%
YoY Change
Club Opening Performance
Club Opening Performance
Club Opening Performance

The Studio Academy of Beauty
The second quarter was a period of transition and strategic investment for The Studio Academy of Beauty as we continued to stabilize operations following our recent acquisition. While early Q2 results were impacted by admissions turnover and reduced student hours, the quarter ended with renewed momentum as student starts rebounded and are now trending higher than prior‑year levels. Total revenue for the quarter was $497,601 compared to $1,813,553 in Q1, resulting in a net income of –$76,553 versus +$218,276 in the previous quarter. These results were primarily driven by a shortfall in clocked student hours and integration costs tied to rebuilding the admissions function and strengthening our leadership structure.
Admissions & Student Growth
Following the retirement of our former Director of Admissions in Q1, we prioritized stabilizing the admissions department with new leadership and documented processes. This work produced a clear turnaround: although the first two months of Q2 lagged expectations, June brought a decisive rebound with student starts now surpassing YoY numbers for the month. At the same time, we are addressing the decline in student hours that affected revenue through initiatives such as transportation support, curriculum enhancements to improve engagement, and a new scholarship program tied to attendance. These steps are already showing positive signs for both retention and student satisfaction.
Cost Management
Looking Ahead
Even as revenue dipped, we successfully reduced fixed costs, particularly in staffing and overhead. Payroll and operating expenses were lowered substantially compared to Q1, demonstrating a disciplined approach to financial management without sacrificing program quality. This leaner structure ensures that as starts and hours continue to improve, the Academy will move back toward profitability more quickly, giving us a stronger financial foundation for future growth.
To strengthen organizational stability and alignment, we elevated an internal leader to Director of Education and reorganized staff roles to better support our mission. These leadership changes, coupled with campus enhancements and cultural improvements, have created a more engaged and accountable team environment. Our focus on building the right culture is essential not only for operational efficiency but also for delivering a high‑quality student experience that drives enrollment and retention.
With admissions stabilized, starts trending higher than the prior year, and fixed costs meaningfully reduced, we are confident in our trajectory. The key focus moving forward is consistently improving student hours to meet threshold requirements and maximize revenue potential. While Q2 reflects transitional challenges, the investments made in leadership, culture, and student engagement have positioned the Academy for a promising future of sustainable growth and profitability.
Leadership & Culture
The Studio Academy of Beauty
The second quarter was a period of transition and strategic investment for The Studio Academy of Beauty as we continued to stabilize operations following our recent acquisition. While early Q2 results were impacted by admissions turnover and reduced student hours, the quarter ended with renewed momentum as student starts rebounded and are now trending higher than prior‑year levels. Total revenue for the quarter was $497,601 compared to $1,813,553 in Q1, resulting in a net income of –$76,553 versus +$218,276 in the previous quarter. These results were primarily driven by a shortfall in clocked student hours and integration costs tied to rebuilding the admissions function and strengthening our leadership structure.
Admissions & Student Growth
Following the retirement of our former Director of Admissions in Q1, we prioritized stabilizing the admissions department with new leadership and documented processes. This work produced a clear turnaround: although the first two months of Q2 lagged expectations, June brought a decisive rebound with student starts now surpassing YoY numbers for the month. At the same time, we are addressing the decline in student hours that affected revenue through initiatives such as transportation support, curriculum enhancements to improve engagement, and a new scholarship program tied to attendance. These steps are already showing positive signs for both retention and student satisfaction.
Cost Management
Looking Ahead
Even as revenue dipped, we successfully reduced fixed costs, particularly in staffing and overhead. Payroll and operating expenses were lowered substantially compared to Q1, demonstrating a disciplined approach to financial management without sacrificing program quality. This leaner structure ensures that as starts and hours continue to improve, the Academy will move back toward profitability more quickly, giving us a stronger financial foundation for future growth.
Despite a smooth integration, Q4 2024 results were affected by: Holiday Revenue Lag: Students only attended class for 12 days in December, resulting in lower recognized revenue. 2. Deal Expenses: New accounting rules required immediate expensing of all acquisition costs, legal, consulting, and audit fees, compressing these into a short period and impacting financial performance.
With admissions stabilized, starts trending higher than the prior year, and fixed costs meaningfully reduced, we are confident in our trajectory. The key focus moving forward is consistently improving student hours to meet threshold requirements and maximize revenue potential. While Q2 reflects transitional challenges, the investments made in leadership, culture, and student engagement have positioned the Academy for a promising future of sustainable growth and profitability.
Leadership & Culture
Financial Summary
As expected during the integration, this quarter reflects transitional costs and one-time investments rather than steady-state earnings. Q2 was a period of efforts to stabilize and reinvest in building the right team, culture, marketing and curriculum. Although our student counts and starts are similar to YoY numbers, we've seen a decrease in student hours which in turn affects recognized revenue.
Summary
(in thousands)
Net Sales
Net Sales
Facilities Cost
Facilities Cost
Marketing & Admissions
Marketing & Admissions
Payroll
Payroll
Educational Services
Educational Services
G&A
Total Expenses
Net Operating Income
Interest Expense
Net Income
Q1 2025
$1,865
216
113
923
164
303
1,718
147
0
$147
Q2 2025
$498
94
47
313
32
87
313
(-77)
0
($77)
Total
$2,363
310
160
1,236
196
390
2,031
70
0
$70
TSAOB: Key Metrics and Performance Indicators
TSAOB: Key Metrics and Performance Indicators
TSAOB: Key Metrics and Performance Indicators
$5,250,000
Purchase Price
$5,250,000
Purchase Price
-
Total Number Of Students
-
Total Number Of Students
-
Total Number of Employees
-
Total Number of Employees
$557,041
Total Revenue Q2
$557,041
Total Revenue Q2
($76,552)
Profit in Q2
($76,552)
Profit in Q2
Additional Metrics
Additional Metrics
Metric
Metric
April
April
May
May
June
June
Starts
YoY Delta
Starts
YoY Delta
40
-40
40
-40
39
-30
39
-30
65
+9
65
+9
Hours
YoY Delta
Hours
YoY Delta
42.1k
1.6k
42.1k
1.6k
35.2k
-2.5k
35.2k
-2.5k
31.6k
-11.0k
31.6k
-11.0k
$5,250,000
Purchase Price
-
Total Number Of Students
-
Total Number of Employees
$557,041
Total Revenue Q2
($76,552)
Profit in Q2
Additional Metrics
Metric
April
May
June
Starts
YoY Delta
40
-40
39
-30
65
+9
Hours
YoY Delta
42.1k
1.6k
35.2k
-2.5k
31.6k
-11.0k

Fund Description
The Alturas Business Fund is an evergreen business investment fund formed to provide accredited investors access to a diversified portfolio of small to medium-sized businesses. The Fund focuses on acquiring and operating businesses with sustainable and predictable cash flow that produce attractive risk-adjusted returns in the Intermountain West and Pacific Northwest, starting with Idaho. The Fund is a $100 million equity and debt offering.
Fund Description
The Alturas Business Fund is an evergreen business investment fund formed to provide accredited investors access to a diversified portfolio of small to medium-sized businesses. The fund focuses on acquiring and operating businesses with sustainable and predictable cash flow that produce attractive risk-adjusted returns in the Intermountain West and Pacific Northwest, starting with Idaho. The Fund is a $100 million equity and debt offering.
Fund Description
The Alturas Business Fund is an evergreen business investment fund formed to provide accredited investors access to a diversified portfolio of small to medium-sized businesses. The Fund focuses on acquiring and operating businesses with sustainable and predictable cash flow that produce attractive risk-adjusted returns in the Intermountain West and Pacific Northwest, starting with Idaho. The Fund is a $100 million equity and debt offering.
Our Investment Offerings
Summary of Equity Offering
Our equity offering allows investors to invest in a diversified portfolio of businesses focused on generating excellent ongoing returns from operations. The Fund's offering is best suited for investors who understand and align with the Fund's investment strategy and value long-term partnerships.
Targeted total realized return: 20%
No Preferred Return
Profit Split: 70% investors, 30% manager
Fees: 1.5% asset management fee
Minimum investment: $100,000
All projections are hypothetical and predicated upon various assumptions that may or may not be identified as such. The future operating and financial performance information contained herein is for illustrative purposes and is not intended to portray any sort of targeted or anticipated returns. There can be no assurance that the Fund will achieve its investment objectives and actual performance may vary significantly. Alturas Ventures, LLC and its affiliates do not provide tax, legal or accounting advice. This material has been prepared for informational purposes only, and is not intended to provide, and should not be relied on for, tax, legal or accounting advice.